...
Data visualization can play an important role in research, specifically in data analysis complementing other analysis methods, such as statistical analysis. But visualization can also play a role in communication and PR.
SURF supports its users Depending on the topic of visualization with:
...
goal for a visualization and its intended audience different visualization styles can be used:
|
| |
|---|---|---|
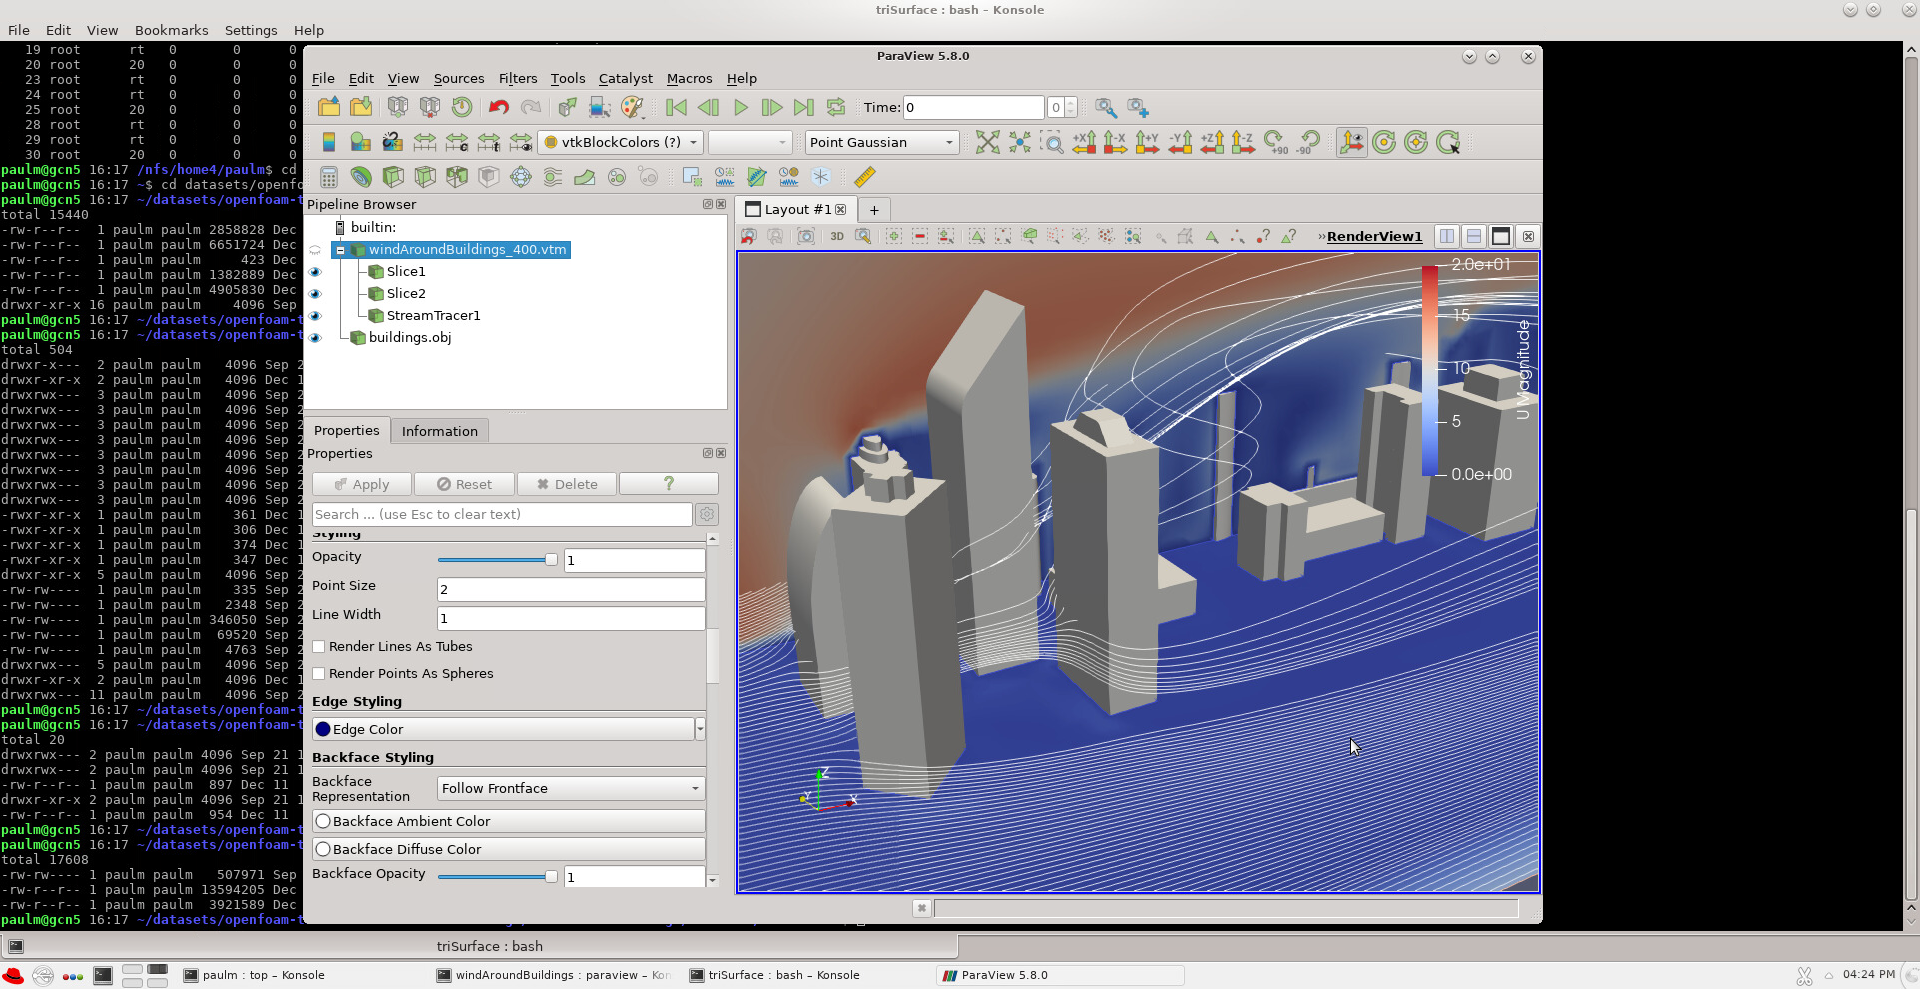
| ParaView running inside a remote VNC desktop on a Cartesius GPU node, showing analysis of an OpenFOAM example |
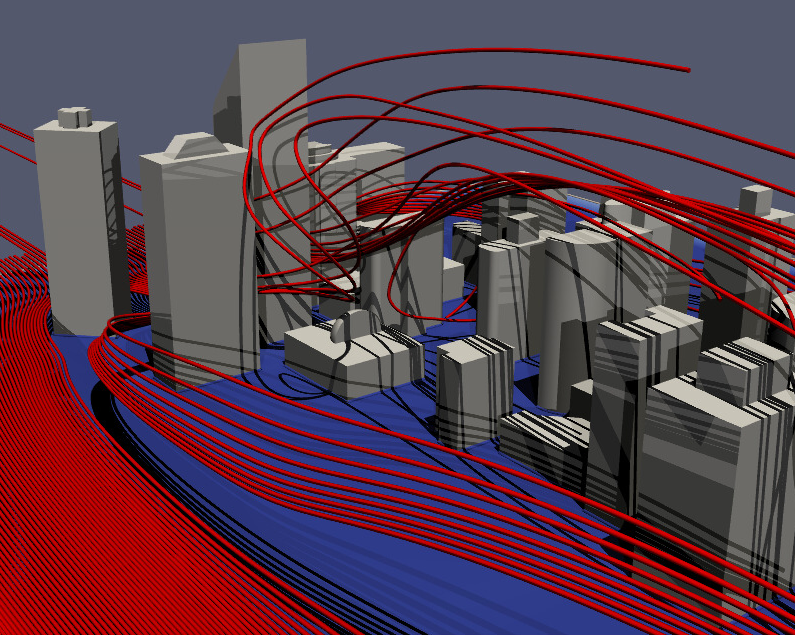
| dataset | Same dataset, also in ParaView, but now with shadows and different color styles |
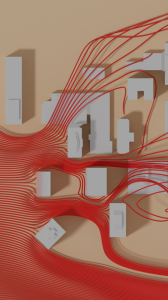
| to give a different look | A more abstract top view of the same geometry, rendered in Blender |
Support
SURF supports its users on the topic of visualization with:
- Support for performing visualization on SURF infrastructure, both for interactive visualization and batch rendering
- Providing courses on visualization
- Realizing targeted visualization projects for users, including software development
- Contribute to innovation activities of SURF, such as using Virtual and Augmented Reality. This also include development of proof-of-concept and demonstrators using such possibilities.
Visualization on SURF infrastructure
Detailed information on performing visualization tasks on SURF infrastructure can be found here.