Overview
Data visualization can play an important role in research, specifically in data analysis complementing other analysis methods, such as statistical analysis. But visualization can also play a role in communication and PR.
Depending on the goal for a visualization and its intended audience different visualization styles can be used:
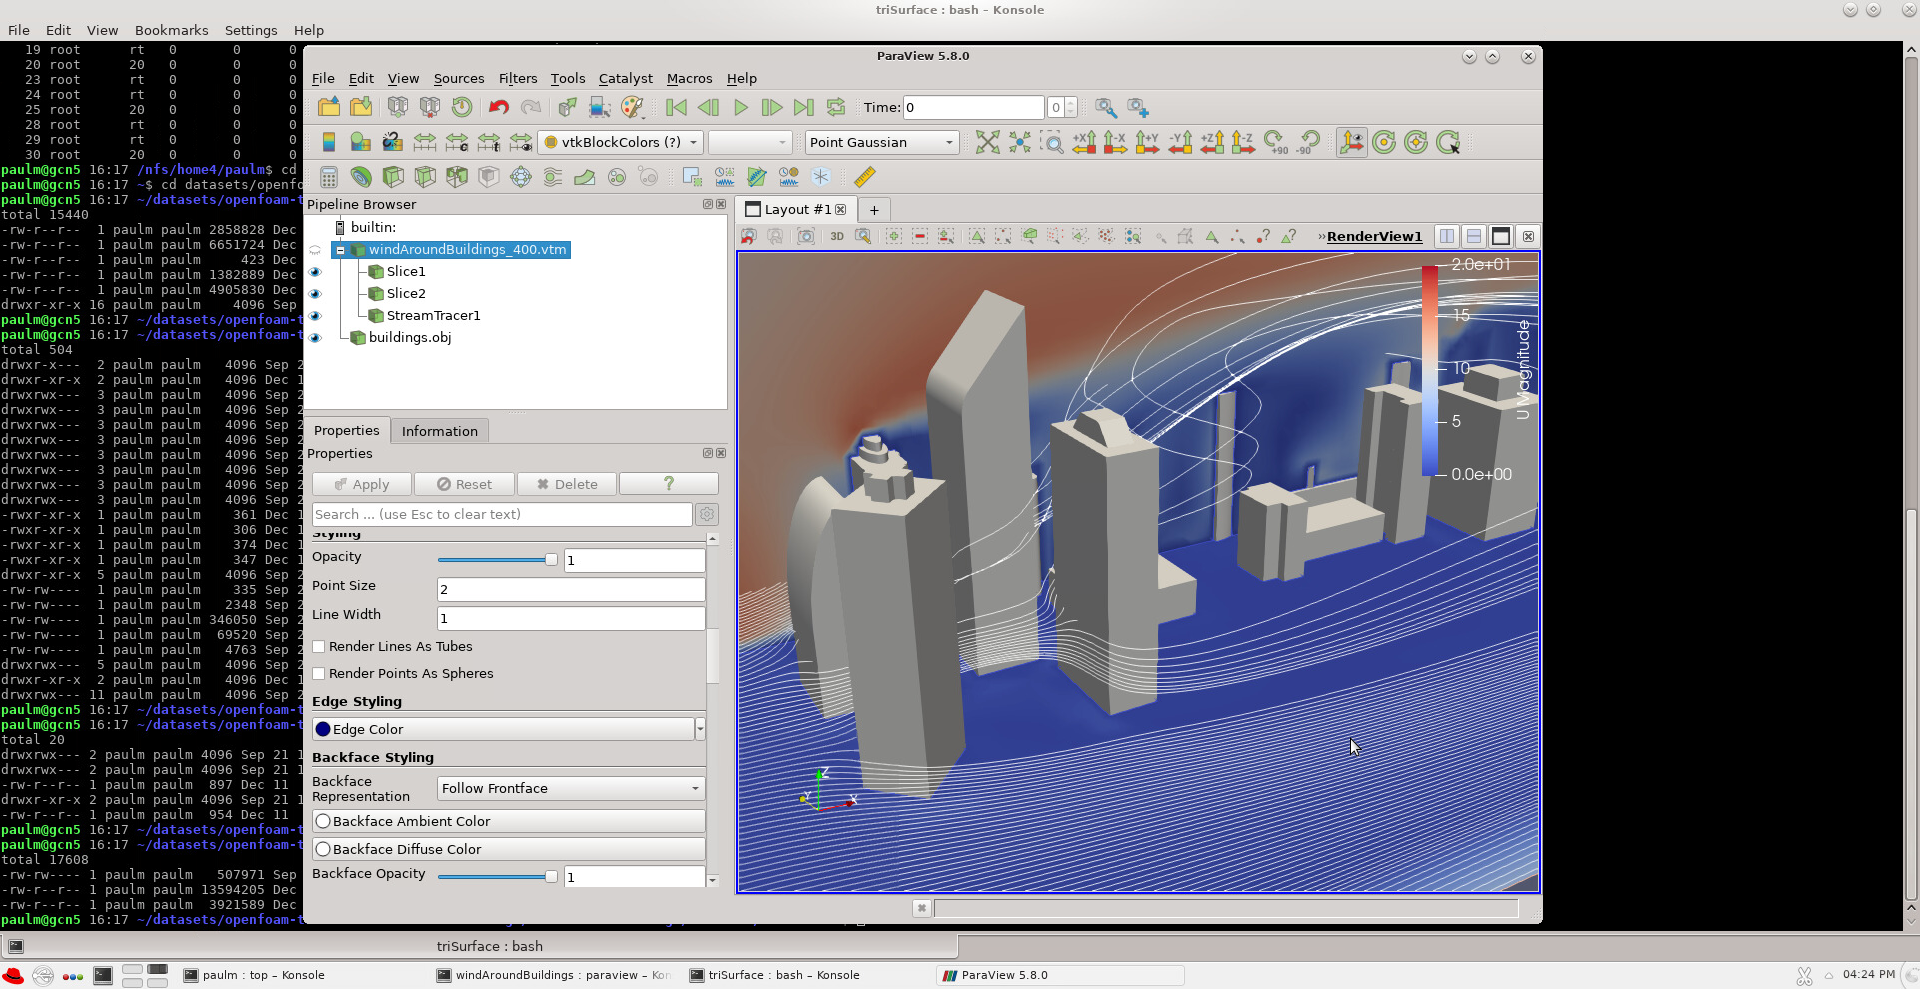
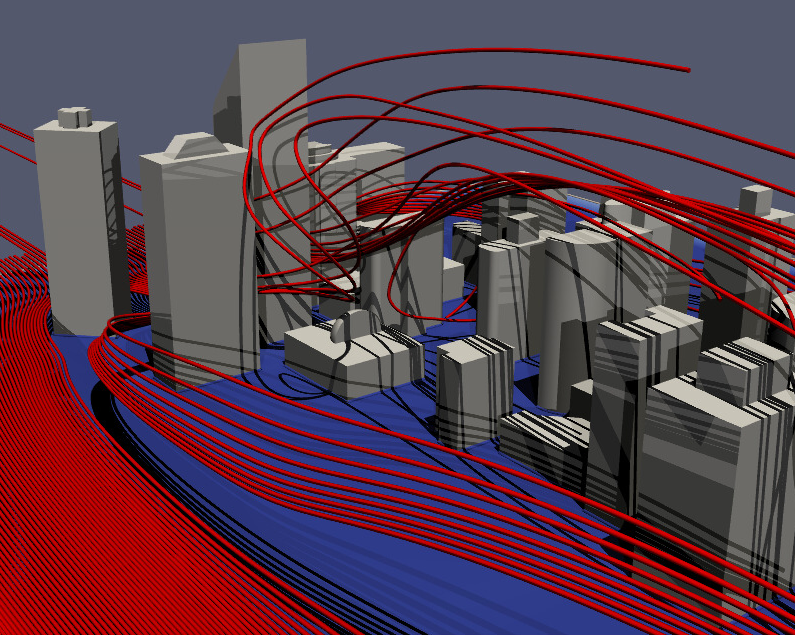
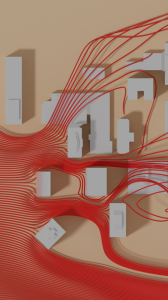
|
| |
|---|---|---|
| ParaView running inside a remote VNC desktop on a Cartesius GPU node, showing analysis of an OpenFOAM example dataset | Same dataset, also in ParaView, but now with shadows and different color styles to give a different look | A more abstract top view of the same geometry, rendered in Blender |
Support
SURF supports its users on the topic of visualization with:
- Support for performing visualization on SURF infrastructure
- Providing courses on visualization
- Realizing targeted visualization projects for users, including software development
- Development of proof-of-concept and demonstrators using innovative visualization possibilities, such as Virtual and Augmented Reality devices, but also 3D printing
Visualization on SURF infrastructure
Detailed information on performing visualization tasks on SURF infrastructure can be found here.